Three posters were on display during the conference: the UIST timeline, the UIST co-authorship network and the UIST h-number. See a few photos of the posters at the conference. Click on the poster images below to download the full-resolution PDF version.
UIST Timeline
The UIST timeline poster was created for the interactive thread. It shows a number of milestones in the history of user interface software and technology, and three curves that represent the cost of a computer, the number of PCs shipped worldwide, the number of online households (in the US).

Poster created by Stéphane Huot of Université Paris-Sud.
Co-Authorship Network
The visualization of the UIST co-authorship network uses the NodeTrix representation. Large rectangles represent communities of researchers closely collaborating, visualized as adjacency matrices. Each researcher is represented as a named row and column. When two researchers co-signed an article, the cell at the intersection of their respective row and columns is colored. Links also join researchers from different communities who co-signed an article. Click on the image below to download the full poster.
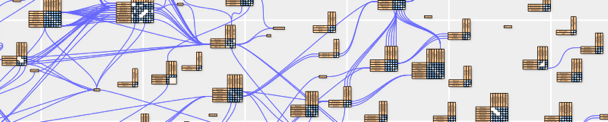
Poster created by Nathalie Henry (the author of the NodeTrix representation), Pierre Dragicevic and Jean-Daniel Fekete of INRIA from the data provided by ACM.
H-Number
The UIST H-number poster shows UIST articles by decreasing number of citations according to Google Scholar. The purple rectangle represents the h-number, i.e. the number h of UIST papers that are cited at least h times. This number was 72 in October 2007 for all UIST papers published between 1988 and 2007. Click on the image below to download the full poster.
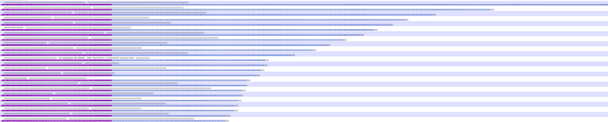
Poster created by Frédéric Vernier of LIMSI-CNRS.